Tag Archives: SFP

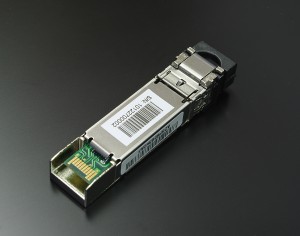
SFP in -INF state

The entire IT industry is packed with mathematics. So instead of keeping things easy we need to work our way around imposed restriction that have been imposed on us by history.

When hardware was developed 1 to 5 decades ago things were (maybe still are) very expensive. Every corner was cut to keep costs low in order to be to sell anything. You can have the latest and greatest but if you’re pricing yourself out of the market the shelf-life of your shares becomes very short and at some stage you basically cease to exist. Companies like DEC and SUN have found out the hard way. Fabulous marvels of engineering but lack of sales and marketing efforts aligned to that engineering feat basically failed to gain sufficient traction in the market and as such they are no more.

Going back to the hardware restrictions and the SFP -INF state

You may encounter some output from an sfpshow (Brocade) or “show transceiver detail” (Cisco) like this:

Temperature: 46 Centigrade
Current: 6.428 mAmps
Voltage: 3261.5 mVolts
RX Power: -inf dBm (0.0 uW)
TX Power: -3.3 dBm (464.2 uW)

So what does that mean? Read on.

Continue reading

FabricWatch FW-1050 alerts on SFP power failures

Whenever you see Fabricwatch throw a lot of a lot of FW-1050 warning messages around indicating an out of boundary power value on SFP’s it is most likely these ports have never been polled by the CP’s.

2014/10/08-04:04:27, [FW-1050], 94159, SLOT 5 | FID 128, WARNING, xxxxxx, Sfp Supply Voltage for port 7/13, is below low boundary(High=3630, Low=2970). Current value is 0 mV.
2014/10/08-04:04:27, [FW-1050], 94160, SLOT 5 | FID 128, WARNING, xxxxxx, Sfp Supply Voltage for port 7/15, is below low boundary(High=3630, Low=2970). Current value is 0 mV.
2014/10/08-04:04:27, [FW-1050], 94161, SLOT 5 | FID 128, WARNING, xxxxxx, Sfp Supply Voltage for port 7/20, is below low boundary(High=3630, Low=2970). Current value is 0 mV.
2014/10/08-04:04:27, [FW-1050], 94162, SLOT 5 | FID 128, WARNING, xxxxxx, Sfp Supply Voltage for port 7/22, is below low boundary(High=3630, Low=2970). Current value is 0 mV.
2014/10/08-04:04:27, [FW-1050], 94163, SLOT 5 | FID 128, WARNING, xxxxxx, Sfp Supply Voltage for port 7/28, is below low boundary(High=3630, Low=2970). Current value is 0 mV.
2014/10/08-04:04:27, [FW-1050], 94164, SLOT 5 | FID 128, WARNING, xxxxxx, Sfp Supply Voltage for port 7/30, is below low boundary(High=3630, Low=2970). Current value is 0 mV.

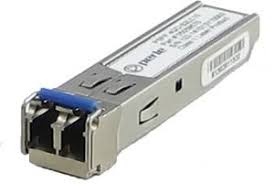
Multi_mode_sfp_transceiver_IMGP7822_wp

On a normally operational port FOS will poll the SFP’s so now and then to check on various things. This includes the usual SFP inventory like serial number, Vendor ID, SFP capabilities etc. Additional things that checked are the TX and RX power levels, voltage and current being used on that particular SFP.

Continue reading

5-minute initial troubleshooting on Brocade equipment

Very often I get involved in cases whereby a massive amount of host logs, array dumps, FC and IP traces are taken which could easily add up to many gigabytes of data. This is then accompanied by a very synoptic problem description such as “I have a problem with my host, can you check?”.
I’m sure the intention is good to provide us all the data but the problem is the lack of the details around the problem. We do require a detailed explanation of what the problem is, when did it occur or is it still ongoing?

There are also things you can do yourself before opening a support ticket. In many occasions you’ll find that the feedback you get from us in 10 minutes results in either the problem being fixed or a simple workaround has made your problem creating less of an impact. Further troubleshooting can then be done in a somewhat less stressful time frame.

This example provides some bullet points what you can do on a Brocade platform. (Mainly since many of the problems I see are related to fabric issues and my job is primarily focused on storage networking.)

First of all take a look at the over health of the switch:

switchstatusshow
Provides an overview of the general components of the switch. These all need to show up HEALTHY and not (as shown here) as “Marginal”

Sydney_ILAB_DCX-4S_LS128:FID128:admin> switchstatusshow
Switch Health Report Report time: 06/20/2013 06:19:17 AM
Switch Name: Sydney_ILAB_DCX-4S_LS128
IP address: 10.XXX.XXX.XXX
SwitchState: MARGINAL
Duration: 214:29

Power supplies monitor MARGINAL
Temperatures monitor HEALTHY
Fans monitor HEALTHY
WWN servers monitor HEALTHY
CP monitor HEALTHY
Blades monitor HEALTHY
Core Blades monitor HEALTHY
Flash monitor HEALTHY
Marginal ports monitor HEALTHY
Faulty ports monitor HEALTHY
Missing SFPs monitor HEALTHY
Error ports monitor HEALTHY

All ports are healthy

switchshow
Provides a general overview of logical switch status (no physical components) plus a list of ports and their status.

  • The switchState should alway be online.
  • The switchDomain should have a unique ID in the fabric.
  • If zoning is configured it should be in the “ON” state.

As for the ports connected these should all be “Online” for connected and operational ports. If you see ports showing “No_Sync” whereby the port is not disabled there is likely a cable or SFP/HBA problem.

If you have configured FabricWatch to enable portfencing you’ll see indications like here with port 75

Obviously for any port to work it should be enabled.

Sydney_ILAB_DCX-4S_LS128:FID128:admin> switchshow
switchName: Sydney_ILAB_DCX-4S_LS128
switchType: 77.3
switchState: Online
switchMode: Native
switchRole: Principal
switchDomain: 143
switchId: fffc8f
switchWwn: 10:00:00:05:1e:52:af:00
zoning: ON (Brocade)
switchBeacon: OFF
FC Router: OFF
Fabric Name: FID 128
Allow XISL Use: OFF
LS Attributes: [FID: 128, Base Switch: No, Default Switch: Yes, Address Mode 0]

Index Slot Port Address Media Speed State Proto
============================================================
0 1 0 8f0000 id 4G Online FC E-Port 10:00:00:05:1e:36:02:bc “BR48000_1_IP146” (downstream)(Trunk master)
1 1 1 8f0100 id N8 Online FC F-Port 50:06:0e:80:06:cf:28:59
2 1 2 8f0200 id N8 Online FC F-Port 50:06:0e:80:06:cf:28:79
3 1 3 8f0300 id N8 Online FC F-Port 50:06:0e:80:06:cf:28:39
4 1 4 8f0400 id 4G No_Sync FC Disabled (Persistent)
5 1 5 8f0500 id N2 Online FC F-Port 50:06:0e:80:14:39:3c:15
6 1 6 8f0600 id 4G No_Sync FC Disabled (Persistent)
7 1 7 8f0700 id 4G No_Sync FC Disabled (Persistent)
8 1 8 8f0800 id N8 Online FC F-Port 50:06:0e:80:13:27:36:30
75 2 11 8f4b00 id N8 No_Sync FC Disabled (FOP Port State Change threshold exceeded)
76 2 12 8f4c00 id N4 No_Light FC Disabled (Persistent)

sfpshow slot/port
One of the most important pieces of a link irrespective of mode and distance is the SFP. On newer hardware and software it provides a lot of info on the overall health of the link.

With older FOS codes there could have been a discrepancy of what was displayed in this output as to what actually was plugged in the port. The reason was that the SFP’s get polled so every now and then for status and update information. If a port was persistent disabled it didn’t update at all so in theory you plug in another SFP but sfpshow would still display the old info. With FOS 7.0.1 and up this has been corrected and you can also see the latest polling time per SFP now.

The question we often get is: “What should these values be?”. The answer is “It depends”. As you can imagine a shortwave 4G SFP required less amps then a longwave 100KM SFP so in essence the SFP specs should be consulted. As a ROT you can say that signal quality depends ont he TX power value minus the link-loss budget. The result should be withing the RX Power specifications of the receiving SFP.

Also check the Current and Voltage of the SFP. If an SFP is broken the indication is often it draws no power at all and you’ll see these two dropping to zero.

Sydney_ILAB_DCX-4S_LS128:FID128:admin> sfpshow 1/1
Identifier: 3 SFP
Connector: 7 LC
Transceiver: 540c404000000000 2,4,8_Gbps M5,M6 sw Short_dist
Encoding: 1 8B10B
Baud Rate: 85 (units 100 megabaud)
Length 9u: 0 (units km)
Length 9u: 0 (units 100 meters)
Length 50u (OM2): 5 (units 10 meters)
Length 50u (OM3): 0 (units 10 meters)
Length 62.5u:2 (units 10 meters)
Length Cu: 0 (units 1 meter)
Vendor Name: BROCADE
Vendor OUI: 00:05:1e
Vendor PN: 57-1000012-01
Vendor Rev: A
Wavelength: 850 (units nm)
Options: 003a Loss_of_Sig,Tx_Fault,Tx_Disable
BR Max: 0
BR Min: 0
Serial No: UAF110480000NYP
Date Code: 101125
DD Type: 0x68
Enh Options: 0xfa
Status/Ctrl: 0x80
Alarm flags[0,1] = 0x5, 0x0
Warn Flags[0,1] = 0x5, 0x0
Alarm Warn
low high low high
Temperature: 25 Centigrade -10 90 -5 85
Current: 6.322 mAmps 1.000 17.000 2.000 14.000
Voltage: 3290.2 mVolts 2900.0 3700.0 3000.0 3600.0
RX Power: -3.2 dBm (476.2uW) 10.0 uW 1258.9 uW 15.8 uW 1000.0 uW
TX Power: -3.3 dBm (472.9 uW) 125.9 uW 631.0 uW 158.5 uW 562.3 uW

State transitions: 1
Last poll time: 06-20-2013 EST Thu 06:48:28

porterrshow
For link state counters this is the most useful command in the switch however there is a perception that this command provides a “silver” bullet to solve port and link issues but that is not the case. Basically it provides a snapshot of the content of the LESB (Link Error Status Block) of a port at that particular point in time. It does not tell us when these counters have accumulated and over which time frame. So in order to create a sensible picture of the statuses of the ports we need a baseline. This baseline can be created to reset all counters and start from zero. To do this issue the “statsclear” command on the cli.

There are 7 columns you should pay attention to from a physical perspective.

enc_in – Encoding errors inside frames. These are errors that happen on the FC1 with encoding 8 to 10 bits and back or, with 10G and 16G FC from 64 bits to 66 and back. Since these happen on the bits that are part of a data frame that are counted in this column.

crc_err – An enc_in error might lead to a CRC error however this column shows frames that have been market as invalid frames because of this crc-error earlier in the datapath. According to FC specifications it is up to the implementation of the programmer if he wants to discard the frame right away or mark it as invalid and send it to the destination anyway. There are pro’s and con’s on both scenarios. So basically if you see crc_err in this column it means the port has received a frame with an incorrect crc but this occurred further upstream.

crc_g_eof – This column is the same as crc_err however the incoming frames are NOT marked as invalid. If you see these most often the enc_in counter increases as well but not necessarily. If the enc_in and/or enc_out column increases as well there is a physical link issue which could be resolved by cleaning connectors, replacing a cable or (in rare cases) replacing the SFP and/or HBA. If the enc_in and enc_out columns do NOT increase there is an issue between the SERDES chip and the SFP which causes the CRC to mismatch the frame. This is a firmware issue which could be resolved by upgrading to the latest FOS code. There are a couple of defects listed to track these.

enc_out – Similar to enc_in this is the same encoding error however this error was outside normal frame boundaries i.e. no host IO frame was impacted. This may seem harmless however be aware that a lot of primitive signals and sequences travel in between normal data frame which are paramount for fibre-channel operations. Especially primitives which regulate credit flow. (R_RDY and VC_RDY) and signal clock synchronization are important. If this column increases on any port you’ll likely run into performance problems sooner or later or you will see a problem with link stability and sync-errors (see below).

Link_Fail – This means a port has received a NOS (Not Operational) primitive from the remote side and it needs to change the port operational state to LF1 (Link Fail 1) after which the recovery sequence needs to commence. (See the FC-FS standards specification for that)

Loss_Sync – Loss of synchronization. The transmitter and receiver side of the link maintain a clock synchronization based on primitive signals which start with a certain bit pattern (K28.5). If the receiver is not able to sync its baud-rate to the rate where it can distinguish between these primitives it will lose sync and hence it cannot determine when a data frame starts.

Loss_Sig – Loss of Signal. This column shows a drop of light i.e. no light (or insufficient RX power) is observed for over 100ms after which the port will go into a non-active state. This counter increases often when the link-loss budget is overdrawn. If, for instance, a TX side sends out light with -4db and the receiver lower sensitivity threshold is -12 db. If the quality of the cable deteriorates the signal to a value lower than that threshold, you will see the port bounce very often and this counter increases. Another culprit is often unclean connectors, patch-panels and badly made fibre splices. These ports should be shut down immediately and the cabling plant be checked. Replacing cables and/or bypassing patch-panels is often a quick way to find out where the problem is.

The other columns are more related to protocol issues and/or performance problems which could be the result of a physical problem but not be a cause. In short look at these 7 columns mentioned above and check if no port increases a value.

============================================
too_short/too_long – indicates a protocol error where SOF or EOF are observed too soon or too late. These two columns rarely increase.

bad_eof – Bad End-of-Frame. This column indicates an issue where the sender has observed and abnormality in a frame or it’s transceiver whilst the frameheader and portions of the payload where already send to its destination. The only way for a transceiver to notify the destination is to invalidate the frame. It truncates the frame and add an EOFni or EOFa to the end. This signals the destination that the frame is corrupt and should be discarded.

F_Rjt and F_Bsy are often seen in Ficon environments where control frames could not be processes in time or are rejected based on fabric configuration or fabric status.

c3timout (tx/rx) – These are counters which indicate that a port is not able to forward a frame in time to it’s destination. These either show a problem downstream of this port (tx) or a problem on this port where it has received a frame meant to be forwarded to another port inside the sames switch. (rx). Frames are ALWAYS discarded at the RX side (since that’s where the buffers hold the frame). The tx column is an aggregate of all rx ports that needs to send frames via this port according to the routing tables created by FSPF.

pcs_err – Physical Coding Sublayer – These values represent encoding errors on 16G platforms and above. Since 16G speeds have changed to 64/66 bits encoding/decoding there is a separate control structure that takes care of this.

As a best practise is it wise to keep a trace of these port errors and create a new baseline every week. This allows you to quickly identify errors and solve these before they can become an problem with an elongated resolution time. Make sure you do this fabric-wide to maintain consistency across all switches in that fabric.

Sydney_ILAB_DCX-4S_LS128:FID128:admin> porterrshow
frames enc crc crc too too bad enc disc link loss loss frjt fbsy c3timeout pcs
tx rx in err g_eof shrt long eof out c3 fail sync sig tx rx err
0: 100.1m 53.4m 0 0 0 0 0 0 0 0 0 0 0 0 0 0 0 0
1: 466.6k 154.5k 0 0 0 0 0 0 0 0 0 0 0 0 0 0 0 0
2: 476.9k 973.7k 0 0 0 0 0 0 0 0 0 0 0 0 0 0 0 0
3: 474.2k 155.0k 0 0 0 0 0 0 0 0 0 0 0 0 0 0 0 0

Make sure that all of these physical issues are solved first. No software can compensate for hardware problems and all OEM support organizations will give you this task anyway before commencing on the issue.

In one of my previous articles I wrote about problems, the cause and the resolution of physical errors. You can find it over here

Regards,
Erwin

Brocade FOS 7.1 and the cool features

After a very busy couple of weeks I’ve spent some time to dissect the release notes of Brocade FOS 7.1 and I must say there are some really nice features in there but also some that I REALLY think should be removed right away.

It may come to no surprise that I always look very critical to whatever come to the table from Brocade, Cisco and others w.r.t. storage networking. Especially the troubleshooting side and therefore the RAS capabilities of the hardware and software have a special place in my heart so if somebody screws up I’ll let them know via this platform. 🙂
So first of all some generics. FOS 7 is supported on the 8 and 16G platforms which cover the Goldeneye2,Condor2 and Condor 3 ASICs plus the AP blades for encryption, SAN extension and FCoE. (cough, cough)….Be aware that it doesn’t support the blades based on the older architecture such as the FR4-18i and FC10-6 (which I think was never bought by anyone.)  Most importantly this is the first version to support the new 6520 switch so if you ever think of buying one it will come shipped with this version installed. 
Software
As for the software features Brocade really cranked up the RAS features. I especially do like the broadening of the scope for D-ports (diagnostics port) to include ICL ports but also between Brocade HBA’s and switch ports. One thing they should be paying attention to though is that they should sell a lot more of these. :-). Also the characteristics of the test patterns such as test duration, frame-sizes and number of frames can now be specified. Also FEC (Forward Error Correction) has been extended to access gateways and long distance ports which should increase stability w.r.t. frame flow. (It still doesn’t improve on signal levels but that is a hardware problem which cannot be fixed by software).
There are some security enhancements for authentication such as extended LDAP and TACACS+ support.
The 7800 can now be used with VF albeit not having XISL functionality. 
Finally the E_D_TOV FC timer value is propagated onto the FCIP complex. What this basically means that previously even though an FC frame had long timed-out according to FC specs (in general 2 seconds) it could still exist on the IP network in a FCIP packet. The remote FC side would discard that frame anyway thus wasting valuable resources. With FOS 7.1 the FCIP complex on the sending side will discard the frame after E_D_TOV has expired.
One of the most underutilised features (besides Fabric Watch) is FDMI (Fabric Device Management Interface). This is a separate FC service (part of the new FC-GS-6 standard) which can hold a huge treasure box of info w.r.t. connected devices. As an example:
FDMI entru
————————————————-
        switch:admin> fdmishow
        Local HBA database contains:
          10:00:8c:7c:ff:01:eb:00
          Ports: 1
            10:00:8c:7c:ff:01:eb:00
              Port attributes:
                FC4 Types: 0x0000010000000000000000000000000000000000000000000000000000000000
                Supported Speed: 0x0000003a
                Port Speed: 0x00000020
                Frame Size: 0x00000840
                Device Name: bfa
                Host Name: X3650050014
                Node Name: 20:00:8c:7c:ff:01:eb:00
                Port Name: 10:00:8c:7c:ff:01:eb:00
                Port Type: 0x0
                Port Symb Name: port2
                Class of Service: 0x08000000
                Fabric Name: 10:00:00:05:1e:e5:e8:00
                FC4 Active Type: 0x0000010000000000000000000000000000000000000000000000000000000000
                Port State: 0x00000005
                Discovered Ports: 0x00000002
                Port Identifier: 0x00030200
          HBA attributes:
            Node Name: 20:00:8c:7c:ff:01:eb:00
            Manufacturer: Brocade
            Serial Number: BUK0406G041
            Model: Brocade-1860-2p
            Model Description: Brocade-1860-2p
            Hardware Version: Rev-A
            Driver Version: 3.2.0.0705
            Option ROM Version: 3.2.0.0_alpha_bld02_20120831_0705
            Firmware Version: 3.2.0.0_alpha_bld02_20120831_0705
            OS Name and Version: Windows Server 2008 R2 Standard | N/A
            Max CT Payload Length: 0x00000840
            Symbolic Name: Brocade-1860-2p | 3.2.0.0705 | X3650050014 |
            Number of Ports: 2
            Fabric Name: 10:00:00:05:1e:e5:e8:00
            Bios Version: 3.2.0.0_alpha_bld02_20120831_0705
            Bios State: TRUE
            Vendor Identifier: BROCADE
            Vendor Info: 0x31000000
———————————————-
and as you can see this shows a lot more than the fairly basic nameserver entries:
——————————————-
N    8f9200;      3;21:00:00:1b:32:1f:c8:3d;20:00:00:1b:32:1f:c8:3d; na
    FC4s: FCP 
    NodeSymb: [41] “QLA2462 FW:v4.04.09 DVR:v8.02.01-k1-vmw38”
    Fabric Port Name: 20:92:00:05:1e:52:af:00 
    Permanent Port Name: 21:00:00:1b:32:1f:c8:3d
    Port Index: 146
    Share Area: No
    Device Shared in Other AD: No
    Redirect: No 
    Partial: No
    LSAN: No
——————————————
Obviously the end-device needs to support this and it has to be enabled. (PLEASE DO !!!!!!!!) It’s invaluable for troubleshooters like me….
One thing that has bitten me a few times was the SFP problem. There has long been a problem that when a port was disabled and a new SFP was plugged in the switch didn’t detect that until the port was enabled and it had polled for up-to-date information. In the mean time you could get old/cached info of the old SFP including temperatures, db values, current, voltage etc.. This seems to be fixed now so thats one less thing to take into account.
Some CLI improvements have been made on various commands with some new parameters which lets you filter and select for certain errors etc.
The biggest idiocracy that has been made with this version is to allow the administrator change the severity level of event-codes. This means that if you have a filter in BNA (or whatever management software you have) to exclude INFO level messages but certain ERROR or CRITICAL messages start to annoy you you could change the severity to INFO and thus they don’t show up anymore. This doesn’t mean th problem is less critical so instead of just fixing the issue we now just pretend it’s not there. From a troubleshooting perspective this is disastrous since we look at a fair chuck of sup-saves each day and if we can’t rely on consistency in a log file it’s useless to have a look in the first place. Another one of those is the difference in deskew values on trunks when FEC is enabled. Due to a coding problem these values can differ up to 40 therefore normally depicting a massive difference in cable length. Only by executing a d-port analysis you can determine if that is really the case or not. My take is that they should fix the coding problem ASAP.  
A similar thing that has pissed me off was the change in sfpshow output. Since the invention of the wheel this has been the worst output in the brocade logs so many people have scripted their ass off to make it more readable.
Normally it looks like this:
=============
Slot  1/Port  0:
=============
Identifier:  3    SFP
Connector:   7    LC
Transceiver: 540c404000000000 2,4,8_Gbps M5,M6 sw Short_dist
Encoding:    1    8B10B
Baud Rate:   85   (units 100 megabaud)
Length 9u:   0    (units km)
Length 9u:   0    (units 100 meters)
Length 50u:  5    (units 10 meters)
Length 62.5u:2    (units 10 meters)
Length Cu:   0    (units 1 meter)
Vendor Name: BROCADE         
Vendor OUI:  00:05:1e
Vendor PN:   57-1000012-01   
Vendor Rev:  A   
Wavelength:  850  (units nm)
Options:     003a Loss_of_Sig,Tx_Fault,Tx_Disable
BR Max:      0   
BR Min:      0   
Serial No:   UAF11051000039A 
Date Code:   101212  
DD Type:     0x68
Enh Options: 0xfa
Status/Ctrl: 0xb0
Alarm flags[0,1] = 0x0, 0x0
Warn Flags[0,1] = 0x0, 0x0
                                          Alarm                  Warn
                                   low        high       low         high
Temperature: 31      Centigrade    -10         90         -5          85
Current:     6.616   mAmps          1.000      17.000     2.000       14.000 
Voltage:     3273.4  mVolts         2900.0      3700.0    3000.0       3600.0 
RX Power:    -2.8    dBm (530.6uW) 10.0   uW 1258.9 uW   15.8   uW  1000.0 uW
TX Power:    -3.3    dBm (465.9 uW)125.9  uW   631.0  uW  158.5  uW   562.3  uW
and that is for every port which basically makes you nuts.
So with some bash,awk,sed magic I scripted the output to look like this:
Port  Speed   Long  Short  Vendor     Serial            Wave   Temp   Current  Voltage   RX-Pwr   TX-Pwr
wave wave number Length
1/0 8G NA 50 m BROCADE UAF11051000039A 850 31 6.616 3273.4 -2.8 -3.3
1/1 8G NA 50 m BROCADE UAF110510000387 850 32 7.760 3268.8 -3.6 -3.3
1/2 8G NA 50 m BROCADE UAF1105100003A3 850 30 7.450 3270.7 -3.3 -3.3
etc....
From a troubleshooting perspective this is so much easier since you can spot issues right away.
Now with FOS 7.1.x the FOS engineers screwed up the SFPshow output which inherently screwed up my script which necessitates a load more work/code/lines to get this back into shape. The same thing goes for the output on the number of credits on virtual channels.
Pre-FOS 7.1 it looks like this:
C:—— blade port 64: E_port ——————————————
C:0xca682400: bbc_trc                 0004 0000 002a 0000 0000 0000 0001 0001 
With FOS 7.1 it looks like this:
bbc registers
=============
0xd0982800: bbc_trc                 20   0    0    0    0    0    0    0    
(Yes, hair pulling stuff, aaarrrcchhhh)
Some more good things. The fabriclog now contains the direction of link resets. Previously we could only see an LR had occurred but we didn’t see who initiated it. Now we can and have the option to figure out in which direction credit issues might have been happening. (phew..)
The CLI history is now also saved after reboots and firmware-upgrades. Its been always a PITA to figure out who had done what at a certain point-in-time. This should help to try and find out.
One other very useful thing that has been added and it a major plus in this release is the addition of the remote WWNN of a switch in the switchshow and islshow output even when the ISL has segmented for whatever reason. This is massively helpful because normally you didn’t have a clue what was connected so you also needed to go through quite some hassle and check cabling or start digging through the portlogdump with some debug flags enabled. Always a troublesome exercise. 
The bonus points from for this release is the addition of the fabretrystats command. This gives us troubleshooters a great overview of statistics of fabric events and commands. 
SW_ILS
————————————————————————————————————–
E/D_Port ELP  EFP  HA_EFP DIA  RDI  BF   FWD  EMT  ETP  RAID GAID ELP_TMR  GRE  ECP  ESC  EFMD ESA  DIAG_CMD 
————————————————————————————————————–
0        0    0    0      0    0    0    0    0    0    0    0    0        0    0    0    0    0    0        
69       0    0    0      0    0    0    0    0    0    0    0    0        0    0    0    0    0    0        
71       0    0    0      0    0    0    0    0    0    0    0    0        0    0    0    0    0    0        
79       0    0    0      0    0    0    0    0    0    0    0    0        0    0    0    0    0    0        
131      0    0    0      0    0    0    0    0    0    0    0    0        0    0    0    0    0    0        
140      0    0    0      0    0    0    0    0    0    0    0    0        0    0    0    0    0    0        
141      0    0    0      0    0    0    0    0    0    0    0    0        0    0    0    0    0    0        
148      0    0    0      0    0    0    0    0    0    0    0    0        0    0    0    0    0    0        
149      0    0    0      0    0    0    0    0    0    0    0    0        0    0    0    0    0    0        
168      0    0    0      0    0    0    0    0    0    0    0    0        0    0    0    0    0    0        
169      0    0    0      0    0    0    0    0    0    0    0    0        0    0    0    0    0    0        
174      0    0    0      0    0    0    0    0    0    0    0    0        0    0    0    0    0    0        
175      0    0    0      0    0    0    0    0    0    0    0    0        0    0    0    0    0    0        
This release also fixes a gazillion defects so its highly advisable to get to this level better sooner than later. Check with your vendor for the latest supported release.
So all in all good stuff but some things should be reverted, NOW!!!. and PLEASE BROCADE: don’t screw up more output in such a way it breaks existing analysis scripts etc…
Cheers
Erwin
One rotten apple spoils the bunch – 2

As mentioned in my previous post it only takes a single device to really cause some serious havoc in a storage environment. Now, “Why”, you may ask, do we have all these redundant kit in our environment like dual fabrics, redundant controllers, dual HBA’s , MPIO software etc whilst this “slow drain device” is the absolute “Achilles heel” of the entire storage infrastructure.

Well, lets take a step back why it has come to this point. As with most hardware and software it develops over time so when we started doing network based storage in the early to midst 90’s we started out with a brand new protocol called Fibre-Channel. (I’m sure you heard of it.) This first iteration was based on arbitrated loop basically meaning we connect the TX port of an HBA to a RX port of a disk or tape device and vice versa effectively causing a loop in a P-t-P topology.  When more HBA’s and/or storage devices were inserted you would get a ring topology. This was OK when you had around 3 or 4 devices in a ring (126 were possible) however from a manageability perspective you can imagine this was nightmare. So a new device called a FC-HUB was invented. This at least provided a single connectivity platform so you could run all your cables to the same box. Internally however this was still a loop topology since each hub port just forwarded the frames to the next port which in turn sent it to the device who, if the frame was not addressed to him sent it back to the hub and so on until it reached the destination. Now, this wasn’t really an effective way of doing things so at first the hub got a bit more intelligent by becoming a, so-called, loop switch. This meant the hub port looked at the destination address and if it wasn’t destined for a device attached to his port he would just sent it on to the next hub. This continued until the destination port was reached who then opened the port and sent the frame to the device.

As you can imagine in some larger loop topologies whenever a device came online or off-line every single device in that loop had to be made aware of this change and as such the LIP (Loop Initialization Protocol) was invented. This protocol made sure that each device got a sort of “update” of the appeared or disappeared device. Later on the loop methodology was almost entirely abandoned by switched fabrics who are far more intelligent in shoving frames in the right direction.

Now remember that Fibre-Channel was developed with one thing in mind ans that was to get the maximum possible speed out of very reliable networks. This also meant that no error-correction is done on a protocol layer and ever possible recovery option available was handled by the upper layer protocols like IP or SCSI.
The problem still was that you always has a single point of failure irrespective of which topology you chose. If you had a server in a loop and the HBA had a problem the entire loop could potentially be mucked up. The same when a AL-HUB or FC switch had a problem. All your connections to your disks would be lost and at best you had the luck to use journal-led filesystems who were relatively fast in recovering. How many of you have waited 5 or more hours for a windows chkdsk to finish just to find out it had no problem of the entire disk was corrupted and you had to restore from tape.

So to circumvent that the storage folk more or less determined that you would need at least 2 of everything physically separated so no component could affect the availability of another. This is were MPIO comes in since when you have multiple paths to a device over separate channels the operating system just sees it as a different device so potentially you end up with two disks (or tapes or whatever) which physically it the same volume. MPIO software fixed that by building in logic to present just one volume to the OS. The other thing they build in MPIO was the link error detection. If a link dropped light or lost sync for whatever reason the HBA would go into a non-active state and sends a signal to the upper layer that it had lost the link, MPIO could redirect all IO’s to the other paths and everything would live happily ever after. If that link came back again MPIO would pick this up and provided the option to use that path again and we were on our way.

This shows that MPIO is relying on HBA state signals upon which MPIO can act. The problem however is that a link might drop somewhere else in the fabric.This way the HBA has no problem since its link is still up, in sync and shows no other issues. The only way for MPIO to observe such a problem is to detect an IO failure and react on one or more of these failures by putting the logical path in an offline state. (The physical link from the HBA to the switch is still online.)
This imposes another problem. What if there is no IO going over that path. Many storage networks are designed in an active passive configuration so only one logical path is sending and receiving IO’s. If there is a problem on the passive side of the path but it is further downstream in the fabric the HBA will not notice this and, as such, there will be no notification to the MPIO layer and MPIO will never put this path offline. In case of a real problem on the active side MPIO tries to fail over however it will run into the same problem and both paths to the devices will fail therefore causing the same problem. Many MPIO software vendors like HDLM from Hitachi have build in logic to test for such conditions. In HDLM you configure so called IEM (Intermittent Error Monitoring). HDLM will poll the target device by sending a sector 0 read request every once in a while to the target device and if that succeeds it will wait for the next polling cycle. If an error has been observed more times than the configured threshold it will put the path offline.

You might think we’ve covered everything now and I wish it was true. MPIO only acts upon frames going AWOL but as you’ve seen in my previous article the major problem is often beyond the data frames and a vast majority these days is due to problems in flow control. This in turn causes slow drain device which have an effect of depleting credits further downstream.

Only the FC layer 2 has any notion of buffer credits and this is never propagated to the upper level protocol stack. This is true for any HBA, firmware, driver, MPIO software and OS. If any problems occur downstream of the initiator or upstream of the target, all devices in that particular path will incur a performance impact and an availability problem at some point in time. MPIO will NOT help in this case as I explained above.

The only way to prevent this from happening is active monitoring and management of you entire fabric and if any apparent link issues do surface fix them immediately.

What do you look for in these cases. Basically all errors that might affect an FC frame or FC traffic flow.
In Brocade FOS there is a command called “porterrshow” of which the output looks like this.

The 7 columns outlined show if any issues with frames and/or primitives have been happening at some point in time. (Use the “help porterrshow” command to show an explanation of each of the columns.). Use subsequent porterrshow command to see if any of them are increasing. The other option is to create a new baseline with the “statsclear” commandso all counters are reset to 0.

Cisco has a similar output albeit being a non-table format with the “show interface detailed-counters”.

The next article outlines an option in Brocade FOS to detect a slow drain device with the bottleneckmon feature and how to  automatically disable a port if too many errors of one of the above counters have occurred in a certain time-frame. If you have a Brocade FOS admin manual look at the port-fencing feature.

Kind regards,
Erwin

One rotten apple spoils the bunch – 1

Last week I had another one. A rotten apple that spoiled the bunch or, in storage terms, a slow drain device causing havoc in a fabric.

This time it was a blade-center server with a dubious HBA connection to the blade-center switch which caused link errors and thus corrupt frames, encoding errors and credit depletion. This, being a blade connected to a blade-switch, also propagated the credit depletion back into the overall SAN fabric and thus the entire fabric suffered significantly from this single problem device.

“Now how does this work” you’ll say. Well, it has everything to do with the flow-control methodology used in FC fabrics. In contrast to the Ethernet and TCP/IP world we, the storage guys, expect a device to behave correctly, as gentleman usually do. That being said, as with everything in life, there are always moment in time when nasty things happen and in the case of the “rotten apple” one storage device being an HBA, tape drive, or storage array may be doing nasty things.

Let’s take a look how this normally should work.

FC devices run on a buffer-to-buffer credit model. This means the device reserves an certain amount of buffers on the FC port itself. This amount of buffers is then communicated to the remote device as credits. So basically devices a gives the remote device permission to use X amount of credits. Each credit is around 2112 bytes (A full 2K data payload plus frame header and footer)

The number of credits each device can handle are “negotiated” during fabric login (FLOGI). On the left a snippet from a FLOGI frame were you see the number of credits in hex.

So what happens after the FLOGI. As an example we use a connection that has negotiated 8 credits either way. If the HBA sends a frame (eg. a SCSI read request) it knows it only has 7 credits left. As soon as the switch port receives the frame it has to make a decision where to send this frame to. It does this based on routing tables, zoning configuration and some other rules, and if everything is correct it will route the frame to the next destination. Meanwhile it simultaneously sends back a, so called, R_RDY primitive. This R_RDY tells the HBA that it can increase the credit counter back by one. So if the current credit counter was 5 it can now bump it back up to 6. (A “primitive” lives only between two directly connected ports and as such it will never traverse a switch or router. A frame can, and will, be switched/routed over one or more links)

Below is a very simplistic overview of two ports on a FC link. On the left we have an HBA and on the right we have a switch port. The blue lines represent the data frames and the red lines the R_RDY primitives.

As I said, it’s pretty simplistic. In theory the HBA on the left could send up to 8 frames before it has to wait for an R_RDY to be returned.

So far all looks good but what if the path from the switch back to the device is broken? Either due to a crack in the cable, unclean connectors, broken lasers etc. The first problem we often see is that bits get flipped on a link which in turn causes encoding errors. FC up to 8G uses a 8b10b encoding decoding mechanism. According to this algorithm the normal 8 data bits are converted to a, so called, 10-bit word or transmission character. These 10 bits are the actual ones that travel over the wire. The remote side uses this same algorithm to revert the 10-bits back into the original 8 data bits. This assures bit level integrity and DC balance on a link. However when a link has a problem as described above, chances are that one or more of these 10-bits flip from a 0 to 1 or vice-versa. The recipient detects this problem however since it is unaware of which bit got corrupted it will discard the entire transmission character. This means that if such a corruption is detected it will discard en entire primitive, or, if the corrupted piece was part of a data frame, this entire frame will be dropped.

A primitive (including the R_RDY) consists of 4 words. (4 * 10 bits). The first word is always a control character (K28.5) and it is followed by three data words (Dxx.x). 

0011111010 1010100010 0101010101 0101010101 (-K28.5 +D21.4  D10.2  D10.2 )

I will not go further into this since its beyond the scope of the article.

So if this R_RDY is discarded the HBA does not know that the switch port has indeed free-ed up the buffer and still think it can only send N-1 frames. The below depicts such a scenario:

As you can see when an R_RDY is lost at some point in time it will become 0 meaning the HBA is unable to send any frames. When this happens an error recovery mechanism kicks in which basically resets the link, clearing all buffers on both side of that link and start from scratch. The upper layers of the FC protocol stack (SCSI-FCP, IPFC etc) have to make sure that any outstanding frame have either to be re-transmitted or the entire IO needs to be aborted in which case this IO in it’s entirety needs to be re-executed. As you can see this will cause a problem on this link since a lot of things are going on except actually making sure your data frames are transmitted. If you think this will not have such an impact be aware that the above sequence might run in less than one tenth of a second and thus the credit depletion can be reached within less than a second. So how does this influence the rest of the fabric since this all seems to be pretty confined within the space of this particular link.

Let broaden the scope a bit from an architectural perspective. Below you see a relatively simple, though architecturally often implemented, core-edge fabric.

Each HBA stands for one server (Green, Blue,Red and Orange), each mapped to a port on a storage array.
Now lets say server Red is a slow drain device or has a problem with its direct link to the switch. It is very intermittently returning credits due to the above explained encoding errors or it is very slow in returning credits due to a driver/firmware timing issue. The HBA sends a read request for an IO of 64K data. This means that 32 data frames (normally FC uses a 2K frame size) will be sent back from the array to the Red server. Meanwhile the other 3 servers and the two storage arrays are also sending and receiving data. If the number of credits negotiated between the HBA’s and the servers is 8 you can see that after the first 16K of that 64K request will be send to Red server however the remaining 48K still is either in transit from the array to the HBA or it is still in some outbound queue in the array. Since the edge switch (on the left) is unable to send frames to the Red server the remaining data frames (from ALL SERVERS) will stack up on the incoming ISL port (bright red). This in turn causes the outbound ISL port on the core switch (the one on the right) to deplete its credits which means that at some point in time no frames are able to traverse the ISL therefore causing most traffic to come to a standstill.

You’ll probably ask “So how do we recover from this?”. Well, basically the port on the edge switch to the Red server will send a LR (Link Reset) after the agreed “hold-time”. The hold time is a calculated period in which the switch will hold frames in its buffers. In most fabrics this is 500ms. So if the switch has had zero credit available during the entire hold period and it has had at least 1 frame in its output buffer it will send a LR to the HBA. This causes both the switch and HBA buffer to clear and the number of credits will return to the value that was negotiated during FLOGI.

If you don’t fix the underlying problem this process will go on forever and, as you’ve seen, will severely impact your entire storage environment.

“OK, so the problem is clear, how do I fix it?”

There are two ways to tackle the problem, the good and the bad way.

The good way is to monitor and manage your fabrics and link for such a behavior. If you see any error counter increasing verify all connections, cables, sfp’s, patch-panels and other hardware sitting in between the two devices. Clean connectors, replace cables and make sure these hardware problems do not re-surface again. My advice is if you see any link behaving like this DISABLE IT IMMEDIATELY !!!! No questions asked.

The bad way is to stick your head in the sand and hope for it go away. I’ve seen many of such issues crippling entire fabrics and due strictly enforced change control severe outages occurred and elongated recovery (very often multiple days) was needed to get things back to normal again. Make sure you implement emergency procedures which allow you to bypass these operational guidelines. It will save you a lot of problems.

Regards,
Erwin van Londen

The importance of clean fibre optics

I attended Cisco Live this week in Melbourne. Since it was very close to home and Cisco was kind enough to provide me with an entry ticket. (Many thanks for this.)

While strolling around the expo floor I ran into the nice people from Fluke Networks who were showing their testing equipment and of course I was very interested in the optical side of the fence. (I haven’t seen wireless storage networks yet so I’ll save that part of their impressive toolkit for later. :-)).

Since I’m doing troubleshooting as a day to day job I see many issues which have characteristics of a physical nature. This can be a bad cable, patch panel, SFP or anything in that nature.

Just when I wanted to start this blog post I saw that my Melbournian buddy  Anthony Vandewerdt just beat me to it and wrote the article “Semmelweiss could see the problem” in which he described the problem of unclean cables and where it might lead to.  (read this first and then come back here.)

In order to complement that article I’ll try to explain why this is so important.

I’m pretty sure that everyone these days know that computers work with bits which are either a 1 or 0. To be able to communicate with other computers (or devices in general) we use transmission of bits with either an on or off signal whether this being an electrical current or an optical wave. Electrical use has the nasty habit that the energy is partially stored in the capacitance of the electrical cable so it has a certain drop zone before it becomes a capacitor with 0 value. You can see this very well if you use a laptop charger with a small led. When you unplug it from the wall-socket it takes a couple of seconds before the current is completely gone from the capacitors in the transformer. This is also one of the primary reasons FC uses a 8b/10b encoding decoding schema to keep a balanced DC value.

The optical to electrical transformers have the same issue albeit not being in the cable itself but more in the physics characteristics of the circuitry. There is a certain fall-off and ramp-up time before current becomes completely zero and completely one respectively. This is very important since this depicts when a receiver should determine if the incoming bit should be seen as a 1 or are 0.

The optics people and companies represented in IEEE and T11-2 do write up the official metrics so this is all being done for you. There is nothing on a switch, array or other network equipment where you can tune this.

The measurement and characteristics of a signal can be measured with an oscillator. The result you see looks like this:

 
The blue lines show the voltage on the oscillator and this shows the, so called, eye-pattern. The hexagon in the middle is determine by the folks of IEEE and T11-2 and can be loaded as a software feature for ease of use on most equipment. (Note: be aware that this differs per technology and optical characteristic like FC, Ethernet, DWDM etc. )
 
The above picture shows a perfect eye-pattern since it show that the ramp-up time (from the bottom blue line to the top) is way before the “decision point” on becoming a 1 and the fall-off time is way after the decision point of becoming a 0.
 
“So what does this have to do with my fibre-cable” you may ask.
When connectors are not clean the light may be reflected back in to the cable causing jitter. It is this jitter that can significantly close the eye-pattern to a point where the receiver can no longer determine if an incoming light should be determined as a 1 or 0. The below picture show that this comes pretty close.


By default it will keep the same value it had on the previous clock cycle. This means that a one remains a 1 even though it actually should have been a 0 and vice versa. The result will be that the bitstream from the receiver buffer into the serdes chip will be incorrect thereby causing a decoding error. For FC it means that the er_enc_out or er_enc_in value on the LESB (Link Error Status Block) is incremented by one (depending if the 10-bit transmission word was part of a FC frame or not). On a Brocade switch in the porterrshow output this is shown in the enc_in or enc_out column.
 
If this happens on a bit which was part of a, normally valid, FC frame the frame now contains an invalid byte. If we not would have a fall-back mechanism this would have led to an invalid byte being send to the operating system and application causing corruption and even system failures. Since we also do a CRC check on the entire frame the destination port will discard it entirely and the upper layer SCSI stack (or whatever protocol resides on the FC4 layer) retry the IO.
 
The problem is that with distance you get loss of power (remember that light is measured in db’s). Depending on the type of cable (OM1,2,3,4) this budget loss on the cable is fixed. Every connection or splice (two optical cables welded together) adds to the link loss and decreases the optical power received on the other side of the link. The problem with dirty connections is that it significantly decreases the optical power which can cause the problem that the value in db the receiver can detect falls outside the specification of that particular SFP. This can cause link losses and port flapping causing all sorts of other nasty issues.
 
The link loss budget can be calculated based on the launch power of the transmitter, the number of connectors and splices in the cable-plant plus the margin on the receiver side.If this all falls below the receiver sensitivity mark the receiver will drop the link and the ports will go offline.


On a Brocade switch you can see the transmitter and receiver value with the “sfpshow” command:
 
 
The specifications of the SFP determine what the transmit and receive power should be. If the actual values of the RX power fall outside the specification of the SFP you should start to look at you cable’s, connectors and start cleaning them. If this doesn’t help there might be another problem like a crack in the cable or the SFP has a broken laser. In this case either replace the cable and/or SFP.
 
Hope this may help to explain why you might see strange things in your fibre channel network if the connectors are not clean and your support organisation is really stressing to fix and maintain your cable plant. I did mention I work in support and I see many connectivity issues resulting in flapping ports, overall performance issues and even data-loss or corruption.
 
If you want to know the characteristics of optical cables or SFP’s I suggest you have a look at the JDSU, Finisar or Avago websites. Also check out the FOA Youtube channel who uploaded some nice video’s which explain in detail the ins and outs of fibre optics.
Regards,
Erwin