Many of you have used and managed fibre-channel based storage networks over the years. It comes to no surprise that a network protocol primarily developed to handle extremely time-sensitive operations is build with extreme demand regarding hardware and software quality and clear guidelines on how these communications should proceed. It is due to this that fibre-channel has become the dominant protocol in datacenters for storage. Continue reading
Closing the Fibre-Channel resiliency gap – 2
So this morning I uploaded my proposal to T11 (13-348v0) in order to get the ball rolling to get it adopted in the FC-LS-3 standard. (That would be awesome). Obviously the task to get things done in a very stable protocol which is known for some serious backward compatibility is not an easy undertaking. I’ve tried (and I think I succeeded) in leaving all existing behaviour intact. This way any transition towards an environment that supports this new architecture is seamless.
The document should be download-able for everyone so any feedback is highly appreciated.
Cheers,
Erwin
Closing the Fibre-Channel resiliency gap
Fibre-Channel is still the predominant transport protocol for storage related data transmission. And rightfully so. Over the past +-two decades it has proven to be very efficient and extremely reliable in moving channel based data transmissions between initiators and targets. The reliability is due to the fact the underlying infrastructure is almost bulletproof. Fibre-Channel requires very high quality hardware as per FC-PI standard and a BER (Bit Error Rate) of less than 10^12 is not tolerated. What Fibre-Channel lacks though is an method of detection and notification to and from hosts if a path to a device is below the required tolerance levels which can cause frames to be dropped without a host to be able to adjust its behaviour on that path. Fibre-Channel relies on upper level protocols (like SCSI) to re-submit the command and that’s about it. When FC was introduced to the market back in the late 90’s, many vendors already had multipath software which could correlate multiple paths to the same LUN into one and in case one path failed it could switch over to the other. Numerous iterations further down the road nothing really exciting has been developed in that area. As per the nature of the chosen class-of-service (3) for the majority of todays FC implementations there is no error recovery done in an FC environment. As per my previous post you’ve seen that MPIO software is also NOT designed to act on and recover failed IO’s. Only in certain circumstances it will fail a path in a way that all new IO’s will be directed to one or more of the remaining paths to that LUN. The crux of the problem is that if any part of the infrastructure is less than what is required from a quality perspective and there is nothing on the host level that actively reacts on these kind of errors you will end up with a very poor performing storage infrastructure. Not only on the host that is active on that path but a fair chance exists other hosts will have the same or similar problems. (see the series of Rotten Apples in previous posts.)
So what is my proposal. Hosts should become more aware of the end-to-end error ratio of paths from their initiators to the targets and back. This results in a view where hosts (or applications) can make a judgement call of which path it can send an IO so the chances of an error are most slim. So how does this need to work. I is all about creating an inventory of least-error-paths. For this to be accomplished we need a way of getting this info to the respective hosts. Basically there are two ways of doing this. 1. Either create a central database which receives updates from each individual switch in the fabric and the host needs to query that database and correlate that with the FSPF (Fabric Shortest Path First) info in order to be able to sort things out or, and this would be my preferred way, we introduce a new ELS frame which can hold all counters currently specified in the LESB (Link Error Status Block) plus some more for future use or vendor specific info. I call this the Error Reporting with Integrated Notification frame. This frame is sent by the initiator to the target over all paths it has at its disposal. Each ingress port (RX port on each switch) which this frame traverses and increment the counters with its own values. When the target receives the frames it flips the SID and DID and send it back to the host. Given the fact this frame is still part of the same FC exchange it will also traverse the same path back so an accurate total error count of that path can be created.
Both options would enable each host of analyzing the overall error count on each path from HBA to target for each lun it has. The problem with option 1 is that the size of the database will increase exponentially proportional with the number of ports and paths and this might become such a huge size that it cannot live inside the fabric anymore and thus needs to be updated in an external management tool. This then has the disadvantage that host are depending on OOB network restrictions and security implications in addition to interop problematic issues. It also has the problem that path errors can be bursty depending on load and/or fabric behaviour. This management application will need to poll these switches for each individual port which will cause an additional load on the processors on each switch even while not necessary. Furthermore it is highly unreliable when the fabric is seeing a fair amount of changes which by default causes re-routing to occur and thus renders a calculation done by the host one minute ago, totally useless.
Option two has the advantage that there is one uniform methodology which is distributed on each initiator, target and path. It therefore has no impact on any switch and/or external management application and is also not relying on network (TCP/IP) related security restrictions, Ethernet boundaries caused by VLANS etc or any other external factors that could influence the operation.
The challenge is however that today there is no ASIC that supports this logic and even if I could get the proposal accepted by T11 it’ll take a while before this is enabled in hardware. In the meantime the ELS frame could be sent to the processor of the switch which in turn does the error count modification in the frame payload, CRC recalculation and other things required. Once more the bottleneck of this method will become the capability of the CPU of that particular switch especially when you have many high port-count blades installed . Until the ASICs are able to do this on the fly in hardware there will be less granularity from a timing perspective since each ELS frame will need to be sent to the CPU. To prevent the CPU from being flogged by all these update and pull requests in the transitional period there is an option to either extend the PLOGI to check if all ports in the path are able to support this frame in hardware or use this new ELS with a special “inventory bit” to determine the capabilities. If any port in the part does not not support the ELS frame it will flick it to 0. This allows the timing interval of each ELS frame to be inline with the capabilities of the end-to-end path. You can imagine that if all ports are able to do this in hardware you can achieve a much finer granularity on timing and hosts can respond much quicker on errors. If any port does not support the new ELS frame the timing can be adjusted to fall in between the E_D_TOV and R_A_TOV values (in general 2 and 10 seconds). The CPU’s on the switches are fairly capable to handle this. This is still much better than any external method of collecting fibre-channel port errors and having an out-of-band query and policy method. Another benefit is that there is a standard method of collecting and distributing the end-to-end path errors so even in multi-vendor environments it is not tied to a single management platform.
So lets look at an example.
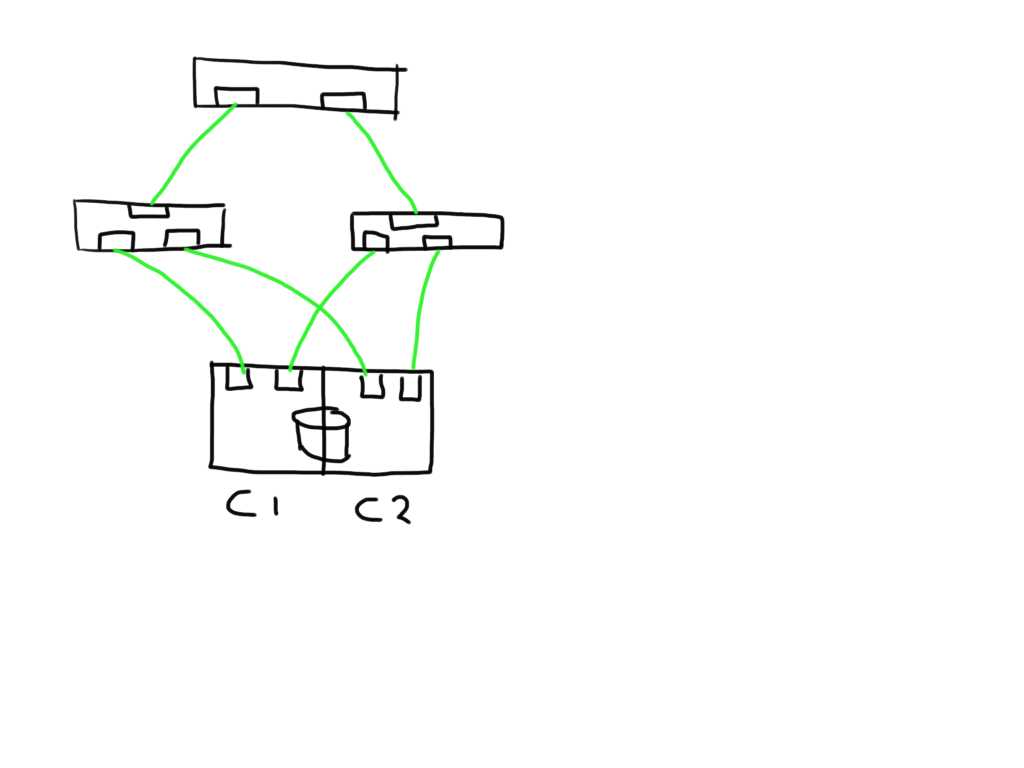 This shows a very simplistic SAN infrastructure where one host has 4 paths over two initiators to 2 storage ports each. All ports seem to be in tip-top shape.
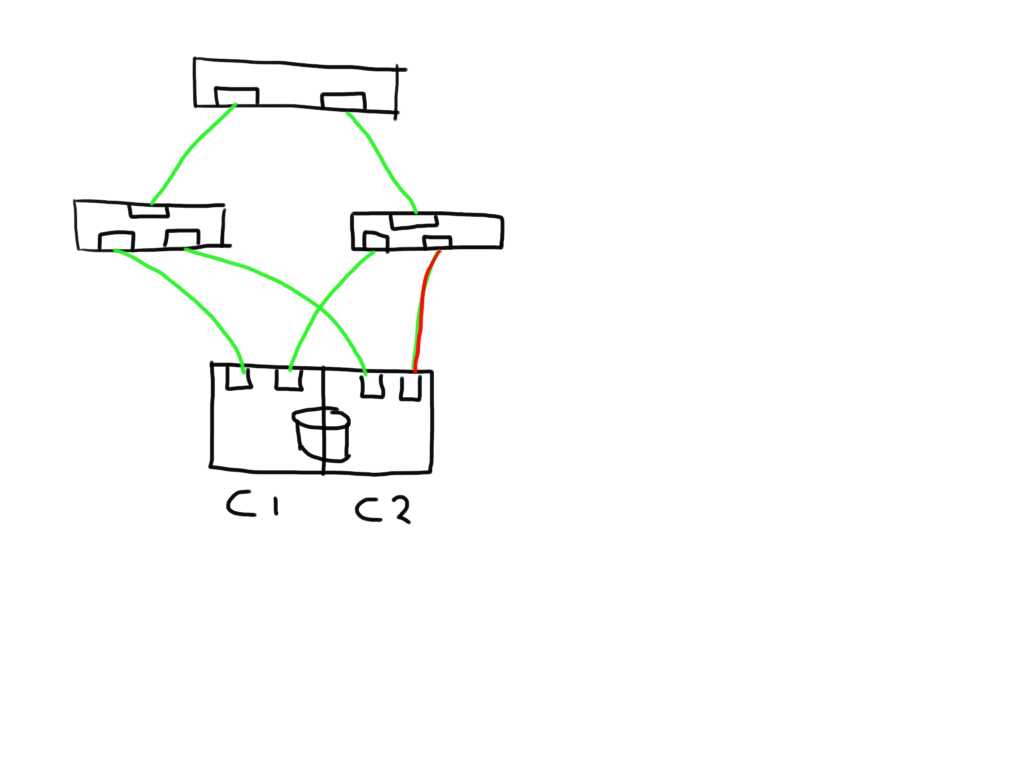 If one link (in this case between the switch and the storage controller) is observing errors (in any direction) the new ELS frame would increment that particular LESB counter value and the result would enable the host to detect the increase in any of the counters on that particular path. Depending on the policies of the operating system or application it could direct the MPIO software to mark that path failed and to remove it from the IO path list.
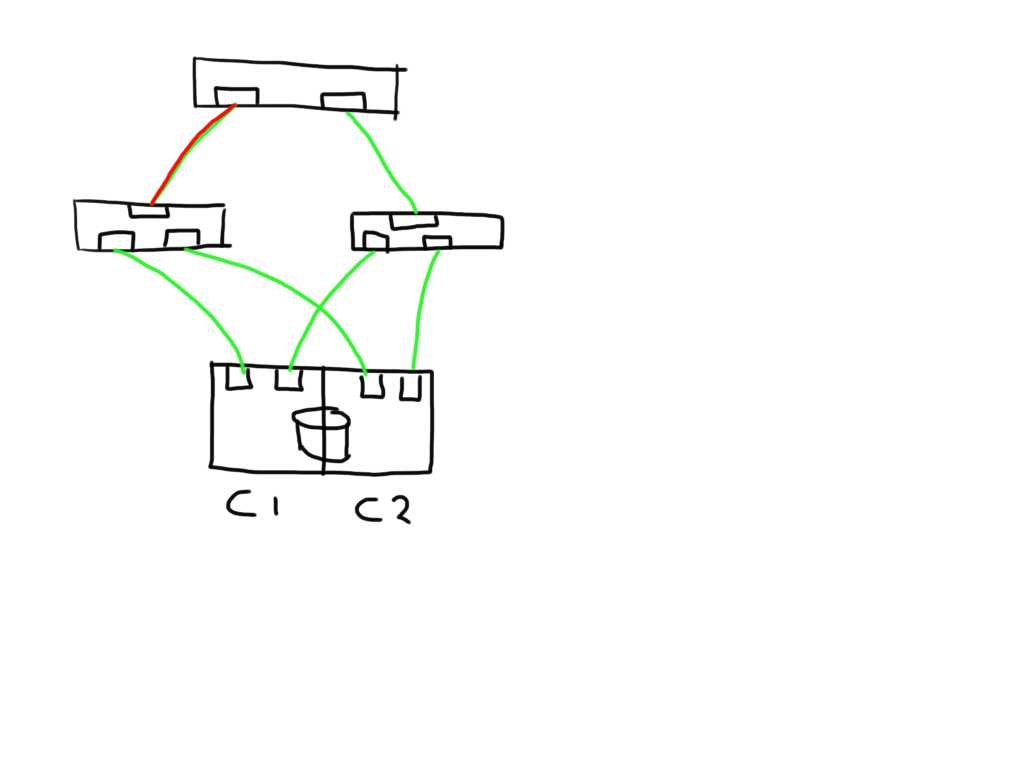
Similarly if a link shows errors between an initiator and switch it will mark 2 paths as bad and has the option to mark these both as failed.
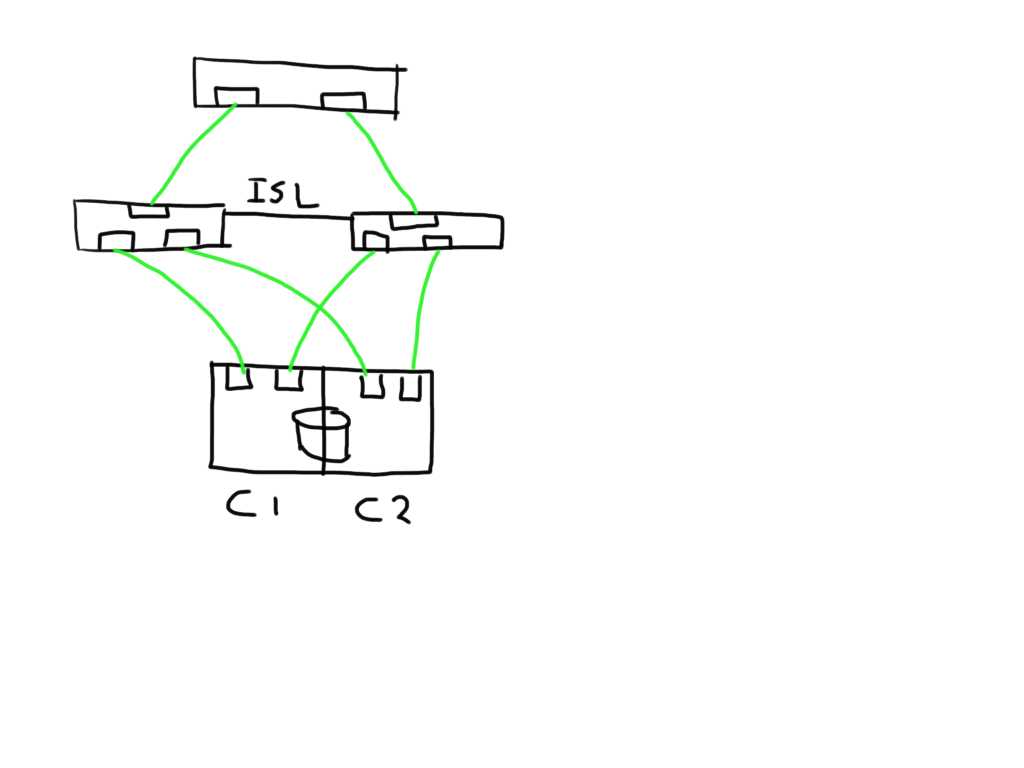
 If you have a meshed fabric the number of paths exponentially grow with each switch and ISL you add. The below show the same structure but because an ISL has been added between the switches the number of potential paths between the host and LUN now grows to 8
 This means that if one of the links is bad the number of potential bad paths also duplicates.
 In this case the paths from both initiators on this bad link are marked faulty and can be removed from the target list by the MPIOsoftware.
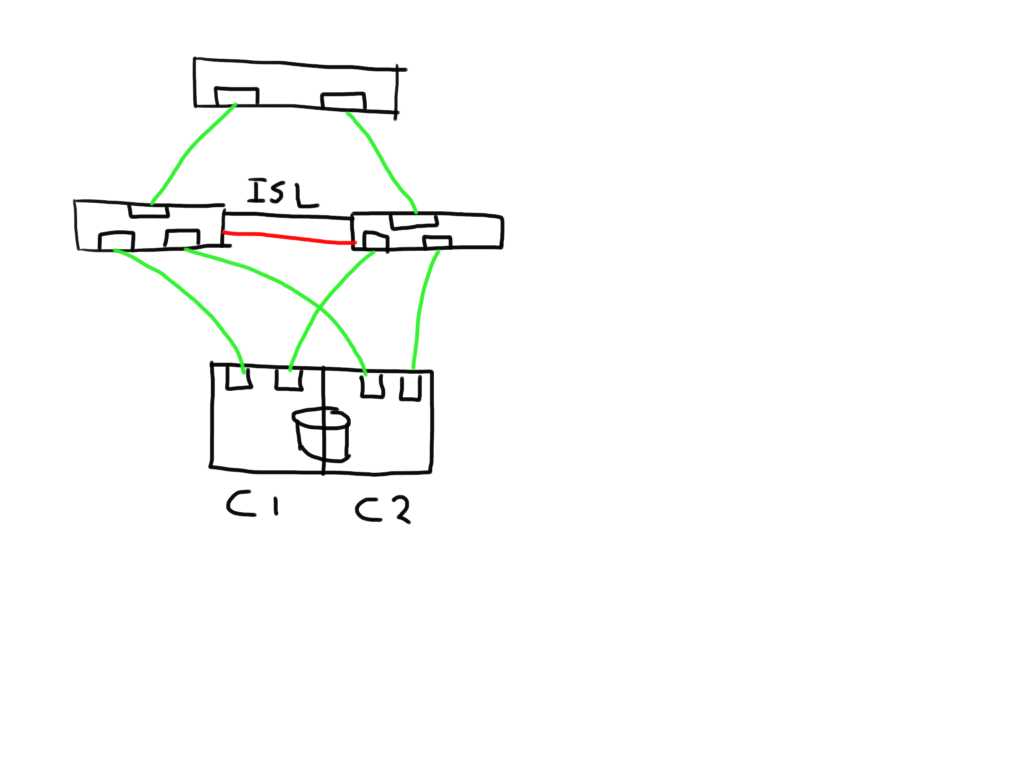 The fun really starts with the unexpected. Lets say you add an additional ISL and for some reason this one is bad. The additional ISL does not add new paths to the path-list on the host since this is transparent and is hidden by the fabric. Frames will just traverse one or the other irrespective of which patch is chosen by the host software. Obviously, since the ELS is just a normal frame, the error counters in the ELS might be skewed based on which of the two ISL’s it has been sent. Depending on the architecture of the switch you’ll have two options, either the ASIC accumulates all counters for both ports into one and add these onto the already existing counters, or you can use a divisional factor where the ASIC sums up all counters of the ISL’s and divides them by the number of ISL’s. The same can be done for trunks(brocade) / portchannels(Cisco). Given the fact that currently most the counters are used in 32bit transmission words the first option is likely to cause the counters to wrap very quickly. The second advantage of a divisional factor is that there will be a consistent averaging across all paths in case you have a larger meshed fabric and thus it will provide a more accurate feedback to the host.
I’m working out the details w.r.t. the internals of the ELS frame itself and which bits to use in which position.
This all should make Fibre-Channel in combination with intelligent host-based software an even more robust protocol for storage based data-transmissions.
Let me know what you think. Any comments, suggestions and remarks are highly appreciated.
Cheers
Erwin
Brocade AAA authentication problem
Do you get nuts about these user-names and passwords you need to remember across all these different systems, platforms and applications. LDAP or RADIUS is your friend. When you make a mistake however it can also be you biggest enemy.
Brocade offers you the option to hook up a switch to LDAP or RADIUS for central authentication. (only Authentication).
An incorrectly configured LDAP or RADIUS configuration on a Brocade switch may lock out network access. This applies to telnet, ssh, webtools and SMI-S.
When AAA configuration is done via the CLI it is very important to specify the correct parameters and specifically the double quotation marks. If ldap is configured with the local database as fall-back the command would be aaaconfig –authspec “ldap;local”. If the quotation marks are omitted the semicolon will be interpreted as a command-line separator. (These commands are executed in a so called restricted Linux bash shell and as such have to abide the rules according to this shell) In essence two commands will then be executed separately.
aaaconfig –authspec ldap
local
The first command will succeed and change the authentication method to LDAP and will immediately logout all logged in users. If LDAP is incorrectly configured all authentication requests will fail and network access is not possible.
To fix this you will need to attach a serial cable to the switch (or Active CP)
- Connect the serial cable to the switch serial management port. (On a blade system like DCXX or 48000 connect to the active CP)
- Login with either root or admin account. (Console access is still allowed).
- Modify the AAA configuration with the command aaaconfig –authspec “ldap;local”.
- Depending on the ldap authentication timeout settings the login will fall back to the local user-database for authentication.
Cheers,
Erwin
5-minute initial troubleshooting on Brocade equipment
Very often I get involved in cases whereby a massive amount of host logs, array dumps, FC and IP traces are taken which could easily add up to many gigabytes of data. This is then accompanied by a very synoptic problem description such as “I have a problem with my host, can you check?”.
I’m sure the intention is good to provide us all the data but the problem is the lack of the details around the problem. We do require a detailed explanation of what the problem is, when did it occur or is it still ongoing?
There are also things you can do yourself before opening a support ticket. In many occasions you’ll find that the feedback you get from us in 10 minutes results in either the problem being fixed or a simple workaround has made your problem creating less of an impact. Further troubleshooting can then be done in a somewhat less stressful time frame.
This example provides some bullet points what you can do on a Brocade platform. (Mainly since many of the problems I see are related to fabric issues and my job is primarily focused on storage networking.)
First of all take a look at the over health of the switch:
switchstatusshow
Provides an overview of the general components of the switch. These all need to show up HEALTHY and not (as shown here) as “Marginal”
Sydney_ILAB_DCX-4S_LS128:FID128:admin> switchstatusshow
Switch Health Report Report time: 06/20/2013 06:19:17 AM
Switch Name: Sydney_ILAB_DCX-4S_LS128
IP address: 10.XXX.XXX.XXX
SwitchState: MARGINAL
Duration: 214:29Power supplies monitor MARGINAL
Temperatures monitor HEALTHY
Fans monitor HEALTHY
WWN servers monitor HEALTHY
CP monitor HEALTHY
Blades monitor HEALTHY
Core Blades monitor HEALTHY
Flash monitor HEALTHY
Marginal ports monitor HEALTHY
Faulty ports monitor HEALTHY
Missing SFPs monitor HEALTHY
Error ports monitor HEALTHYAll ports are healthy
switchshow
Provides a general overview of logical switch status (no physical components) plus a list of ports and their status.
- The switchState should alway be online.
- The switchDomain should have a unique ID in the fabric.
- If zoning is configured it should be in the “ON” state.
As for the ports connected these should all be “Online” for connected and operational ports. If you see ports showing “No_Sync” whereby the port is not disabled there is likely a cable or SFP/HBA problem.
If you have configured FabricWatch to enable portfencing you’ll see indications like here with port 75
Obviously for any port to work it should be enabled.
Sydney_ILAB_DCX-4S_LS128:FID128:admin> switchshow
switchName: Sydney_ILAB_DCX-4S_LS128
switchType: 77.3
switchState: Online
switchMode: Native
switchRole: Principal
switchDomain: 143
switchId: fffc8f
switchWwn: 10:00:00:05:1e:52:af:00
zoning: ON (Brocade)
switchBeacon: OFF
FC Router: OFF
Fabric Name: FID 128
Allow XISL Use: OFF
LS Attributes: [FID: 128, Base Switch: No, Default Switch: Yes, Address Mode 0]Index Slot Port Address Media Speed State Proto
============================================================
0 1 0 8f0000 id 4G Online FC E-Port 10:00:00:05:1e:36:02:bc “BR48000_1_IP146” (downstream)(Trunk master)
1 1 1 8f0100 id N8 Online FC F-Port 50:06:0e:80:06:cf:28:59
2 1 2 8f0200 id N8 Online FC F-Port 50:06:0e:80:06:cf:28:79
3 1 3 8f0300 id N8 Online FC F-Port 50:06:0e:80:06:cf:28:39
4 1 4 8f0400 id 4G No_Sync FC Disabled (Persistent)
5 1 5 8f0500 id N2 Online FC F-Port 50:06:0e:80:14:39:3c:15
6 1 6 8f0600 id 4G No_Sync FC Disabled (Persistent)
7 1 7 8f0700 id 4G No_Sync FC Disabled (Persistent)
8 1 8 8f0800 id N8 Online FC F-Port 50:06:0e:80:13:27:36:30
75 2 11 8f4b00 id N8 No_Sync FC Disabled (FOP Port State Change threshold exceeded)
76 2 12 8f4c00 id N4 No_Light FC Disabled (Persistent)
sfpshow slot/port
One of the most important pieces of a link irrespective of mode and distance is the SFP. On newer hardware and software it provides a lot of info on the overall health of the link.
With older FOS codes there could have been a discrepancy of what was displayed in this output as to what actually was plugged in the port. The reason was that the SFP’s get polled so every now and then for status and update information. If a port was persistent disabled it didn’t update at all so in theory you plug in another SFP but sfpshow would still display the old info. With FOS 7.0.1 and up this has been corrected and you can also see the latest polling time per SFP now.
The question we often get is: “What should these values be?”. The answer is “It depends”. As you can imagine a shortwave 4G SFP required less amps then a longwave 100KM SFP so in essence the SFP specs should be consulted. As a ROT you can say that signal quality depends ont he TX power value minus the link-loss budget. The result should be withing the RX Power specifications of the receiving SFP.
Also check the Current and Voltage of the SFP. If an SFP is broken the indication is often it draws no power at all and you’ll see these two dropping to zero.
Sydney_ILAB_DCX-4S_LS128:FID128:admin> sfpshow 1/1
Identifier: 3 SFP
Connector: 7 LC
Transceiver: 540c404000000000 2,4,8_Gbps M5,M6 sw Short_dist
Encoding: 1 8B10B
Baud Rate: 85 (units 100 megabaud)
Length 9u: 0 (units km)
Length 9u: 0 (units 100 meters)
Length 50u (OM2): 5 (units 10 meters)
Length 50u (OM3): 0 (units 10 meters)
Length 62.5u:2 (units 10 meters)
Length Cu: 0 (units 1 meter)
Vendor Name: BROCADE
Vendor OUI: 00:05:1e
Vendor PN: 57-1000012-01
Vendor Rev: A
Wavelength: 850 (units nm)
Options: 003a Loss_of_Sig,Tx_Fault,Tx_Disable
BR Max: 0
BR Min: 0
Serial No: UAF110480000NYP
Date Code: 101125
DD Type: 0x68
Enh Options: 0xfa
Status/Ctrl: 0x80
Alarm flags[0,1] = 0x5, 0x0
Warn Flags[0,1] = 0x5, 0x0
Alarm Warn
low high low high
Temperature: 25 Centigrade -10 90 -5 85
Current: 6.322 mAmps 1.000 17.000 2.000 14.000
Voltage: 3290.2 mVolts 2900.0 3700.0 3000.0 3600.0
RX Power: -3.2 dBm (476.2uW) 10.0 uW 1258.9 uW 15.8 uW 1000.0 uW
TX Power: -3.3 dBm (472.9 uW) 125.9 uW 631.0 uW 158.5 uW 562.3 uWState transitions: 1
Last poll time: 06-20-2013 EST Thu 06:48:28
porterrshow
For link state counters this is the most useful command in the switch however there is a perception that this command provides a “silver” bullet to solve port and link issues but that is not the case. Basically it provides a snapshot of the content of the LESB (Link Error Status Block) of a port at that particular point in time. It does not tell us when these counters have accumulated and over which time frame. So in order to create a sensible picture of the statuses of the ports we need a baseline. This baseline can be created to reset all counters and start from zero. To do this issue the “statsclear” command on the cli.
There are 7 columns you should pay attention to from a physical perspective.
enc_in – Encoding errors inside frames. These are errors that happen on the FC1 with encoding 8 to 10 bits and back or, with 10G and 16G FC from 64 bits to 66 and back. Since these happen on the bits that are part of a data frame that are counted in this column.
crc_err – An enc_in error might lead to a CRC error however this column shows frames that have been market as invalid frames because of this crc-error earlier in the datapath. According to FC specifications it is up to the implementation of the programmer if he wants to discard the frame right away or mark it as invalid and send it to the destination anyway. There are pro’s and con’s on both scenarios. So basically if you see crc_err in this column it means the port has received a frame with an incorrect crc but this occurred further upstream.
crc_g_eof – This column is the same as crc_err however the incoming frames are NOT marked as invalid. If you see these most often the enc_in counter increases as well but not necessarily. If the enc_in and/or enc_out column increases as well there is a physical link issue which could be resolved by cleaning connectors, replacing a cable or (in rare cases) replacing the SFP and/or HBA. If the enc_in and enc_out columns do NOT increase there is an issue between the SERDES chip and the SFP which causes the CRC to mismatch the frame. This is a firmware issue which could be resolved by upgrading to the latest FOS code. There are a couple of defects listed to track these.
enc_out – Similar to enc_in this is the same encoding error however this error was outside normal frame boundaries i.e. no host IO frame was impacted. This may seem harmless however be aware that a lot of primitive signals and sequences travel in between normal data frame which are paramount for fibre-channel operations. Especially primitives which regulate credit flow. (R_RDY and VC_RDY) and signal clock synchronization are important. If this column increases on any port you’ll likely run into performance problems sooner or later or you will see a problem with link stability and sync-errors (see below).
Link_Fail – This means a port has received a NOS (Not Operational) primitive from the remote side and it needs to change the port operational state to LF1 (Link Fail 1) after which the recovery sequence needs to commence. (See the FC-FS standards specification for that)
Loss_Sync – Loss of synchronization. The transmitter and receiver side of the link maintain a clock synchronization based on primitive signals which start with a certain bit pattern (K28.5). If the receiver is not able to sync its baud-rate to the rate where it can distinguish between these primitives it will lose sync and hence it cannot determine when a data frame starts.
Loss_Sig – Loss of Signal. This column shows a drop of light i.e. no light (or insufficient RX power) is observed for over 100ms after which the port will go into a non-active state. This counter increases often when the link-loss budget is overdrawn. If, for instance, a TX side sends out light with -4db and the receiver lower sensitivity threshold is -12 db. If the quality of the cable deteriorates the signal to a value lower than that threshold, you will see the port bounce very often and this counter increases. Another culprit is often unclean connectors, patch-panels and badly made fibre splices. These ports should be shut down immediately and the cabling plant be checked. Replacing cables and/or bypassing patch-panels is often a quick way to find out where the problem is.
The other columns are more related to protocol issues and/or performance problems which could be the result of a physical problem but not be a cause. In short look at these 7 columns mentioned above and check if no port increases a value.
============================================
too_short/too_long – indicates a protocol error where SOF or EOF are observed too soon or too late. These two columns rarely increase.
bad_eof – Bad End-of-Frame. This column indicates an issue where the sender has observed and abnormality in a frame or it’s transceiver whilst the frameheader and portions of the payload where already send to its destination. The only way for a transceiver to notify the destination is to invalidate the frame. It truncates the frame and add an EOFni or EOFa to the end. This signals the destination that the frame is corrupt and should be discarded.
F_Rjt and F_Bsy are often seen in Ficon environments where control frames could not be processes in time or are rejected based on fabric configuration or fabric status.
c3timout (tx/rx) – These are counters which indicate that a port is not able to forward a frame in time to it’s destination. These either show a problem downstream of this port (tx) or a problem on this port where it has received a frame meant to be forwarded to another port inside the sames switch. (rx). Frames are ALWAYS discarded at the RX side (since that’s where the buffers hold the frame). The tx column is an aggregate of all rx ports that needs to send frames via this port according to the routing tables created by FSPF.
pcs_err – Physical Coding Sublayer – These values represent encoding errors on 16G platforms and above. Since 16G speeds have changed to 64/66 bits encoding/decoding there is a separate control structure that takes care of this.
As a best practise is it wise to keep a trace of these port errors and create a new baseline every week. This allows you to quickly identify errors and solve these before they can become an problem with an elongated resolution time. Make sure you do this fabric-wide to maintain consistency across all switches in that fabric.
Sydney_ILAB_DCX-4S_LS128:FID128:admin> porterrshow
frames enc crc crc too too bad enc disc link loss loss frjt fbsy c3timeout pcs
tx rx in err g_eof shrt long eof out c3 fail sync sig tx rx err
0: 100.1m 53.4m 0 0 0 0 0 0 0 0 0 0 0 0 0 0 0 0
1: 466.6k 154.5k 0 0 0 0 0 0 0 0 0 0 0 0 0 0 0 0
2: 476.9k 973.7k 0 0 0 0 0 0 0 0 0 0 0 0 0 0 0 0
3: 474.2k 155.0k 0 0 0 0 0 0 0 0 0 0 0 0 0 0 0 0
Make sure that all of these physical issues are solved first. No software can compensate for hardware problems and all OEM support organizations will give you this task anyway before commencing on the issue.
In one of my previous articles I wrote about problems, the cause and the resolution of physical errors. You can find it over here
Regards,
Erwin
Google Earth on Linux 64
I use Google Eearth fairly regularly for all sort of things. I like searching places around the world and looking at additional info from for instance National Geographic. It is therefore most annoying that whenever Google decides to change something GE starts to crash for whatever reason most likely due to conflicts between libraries. The crashlogs you’ll see are like:
Major Version 7
Minor Version 1
Build Number 0001
Build Date Jul 12 2013
Build Time 04:22:47
OS Type 3
OS Major Version 3
OS Minor Version 8
OS Build Version 13
OS Patch Version 0
Crash Signal 4
Crash Time 1375944957
Up Time 0.809264Stacktrace from glibc:
./libgoogleearth_free.so(+0x23915c)[0x7f1d7c46d15c]
./libgoogleearth_free.so(+0x2393bd)[0x7f1d7c46d3bd]
/lib64/libc.so.6[0x33462359b0]
/usr/lib64/nvidia-304xx/libnvidia-glcore.so.304.88(_nv015glcore+0x0)[0x3b89de8be0]
I’m not smart enough to sort out binary stack dumps but I’m pretty good at troubleshooting and logical thinking. The guys on the GE devteam obviously are very graphically oriented and they take every opportunity to suck out as much juice out of hardware to make the graphical rendering at smooth as possible. They therefore look at the loaded graphics drivers and if possible start making use of any piece of graphical kit they can find to use it.
I have an NVidia card with CUDA cores which can accelerate these graphical screen-gadgets pretty well so if there is a conflict in these libraries you’ll get the program to crash.
Basically what I did was I upgraded the NVidia driver to 319.32 and at least that solved the above issue. Than I ran into the problem of GE itself were it saw some sort of corruption in one or more cached files. I removed these from the ~/.googleearth directory after which GE started. I still get the below messages when I start GE but these do not seem to be of influence of using it.
[0809/130918:ERROR:net_util.cc(2195)] Not implemented reached in bool net::HaveOnlyLoopbackAddresses()
[0809/130918:WARNING:backend_impl.cc(1875)] Destroying invalid entry.
[0809/130918:ERROR:nss_ocsp.cc(581)] No URLRequestContext for OCSP handler.
[0809/130920:ERROR:nss_ocsp.cc(581)] No URLRequestContext for OCSP handler.
[0809/130920:ERROR:nss_ocsp.cc(581)] No URLRequestContext for OCSP handler.
[0809/130920:ERROR:nss_ocsp.cc(581)] No URLRequestContext for OCSP handler.
My version currently is :
Google Earth – 7.1.1.1888
Build Date 7/12/2013
Build Time 4:22:44 am
Renderer OpenGL
Operating System Linux (3.8.13.0)
Video Driver NVIDIA Corporation
Max Texture Size 16384×16384
available video memory 2048 MB
Server kh.google.com
Whenever you run into some other inexplicable issues you might start with clearing the cache at ~/unified_cache_leveldb_leveldb2/*
Hope this helps someone.
Cheers,
Erwin
Brocade MAPS – Improvement in usability, reduction in functionality
(This post is mostly obsolete to to the many improvements in FSO 7.3, 7.4 and beyond. I would seriously urge you to consider using MAPS. See here)
With FOS 7.2.0 Brocade introduced MAPS (no not the google version). It’s a new functionality that is intended to replace and improve the usability of Fabric Watch. As I wrote earlier here Fabric Watch has always been one of the best pieces of functionality in FOS and I’ve used it ever since they introduced it al the way back in FOS 3.x or 4.x I think it was (Yes I’m that old). FW enables you to create thresholds on numerous elements in a switch or fabric. This goes from port-errors to environmental problems like elevated temperature and other hardware problems. In addition individual actions can be configured like sending out emails, snmp traps or yet even better, disable ports in case it can have or already has significant ramifications and follow-up issues in a fabric.
The biggest problem with FW always has been the sheer amount of options, menu items and CLI parameters which caused it a to be a challenge to configure it to such an extend it became useful. It is like using VI (the text editor, not the company) for the first time, you’d rather have a root canal and endoscopy at the same time but as soon as you have the hang of it you discover the sheer power of this tool and the amount of proactive management, alerts and other options will make you SAN almost bullet proof (I’m not saying monkey-proof :-)). This is also the reason that FW is either not used or configured with incorrect parameters so that it will spit out too many or too few notifications. Once again I would like to stress the importance of this great tool and the ROI will certainly double both in time and money.
So then why MAPS. Remember that Brocade is also fairly active in the networking side of the fence with the acquisition of Foundry back in 2008 and more recently Vyatta to obtain a software based networking virtualization stack. With the introduction of their FabricVision roadmap you can see that overall management needs to be synchronised and consolidated. Having 4 different hardware and software platforms (SAN, Ethernet, VCS/Converged and virtual) means this is a fairly daunting task. Brocade Network Advisor has become the management framework to handle all this albeit it is still a work in progress.
MAPS simplifies the overall management of the RAS features in FOS to more align with the capabilities across these platforms. Secondly, the number of support cases related to physical issues has increased significantly ever since the FC speeds and feeds went to 8G and 16G. 8G and 16G did not only require an update on switches and HBA’s but also the requirements on cable quality changed. OM2 is no longer sufficient on these speeds. OM3 and OM4 is required for the respective connection speeds from end-to-end including patch-panels, connectors etc. Since this physical aspect of many infrastructures is not updated the increase in problems observed are almost linear proportional to the degraded quality of the physical cable plant. I’ve seen many examples whereby an 8G port was unable to connect and just by reducing the speed back to 4G it did not observe any issues. MAPS cannot help you with re-cabling your plant but it can help stay on top of issues that might surface.
What I don’t like about MAPS is that is has significantly reduced the granularity of elements, objects and values you can configure. This might not suit every environment so conflicts of interest might become a problem. Also some settings may be converted from FW but you can’t change it. This is especially annoying if you made an incorrect configuration, converted to MAPS and all of a sudden you get hit by a gazillion alerts which you then cannot modify. Also very annoying is the issue that you cannot configure different email notifications to different people. If you encounter a temperature problem you might want to let the operators of the data-centre know of this issue but when a port observes a protocol problem they don’t need to know. Currently your can’t change that.
I do think MAPS is currently a work in progress as previously mentioned and thus I cannot recommend to migrate to MAPS just yet. Maybe in FOS 7.3 or even 8 it has matured enough to fully replace Fabric Watch. If you have licenses for Fabric Watch I would certainly recommend investing some time in this and configure it according to your needs. The FW Admin guide is a great resource and it will certainly increase the stability of your fabric.
Cheers,
Erwin
UPDATE: Brocade has pulled FOS 7.2.0 due to the fact it introduced so many new defects that it became more pretty dangerous to even think about running this version. As usual the x.x.0 releases should be avoided.